- I wouldn’t be surprised at all if the market’s recent tech wreck caused the long dormant Value Police to run to the spotlight.
- Ignore them; they’re still wrong.
- Value can never work in isolation, but always works when joined with growth.
Softbank shenanigans aside, I wouldn’t be at all if the market’s recent tech wreck caused the Value Police, who seem to have been defunded long ago, to jump, pointing fingers, and saying “See, see, we told you so, it’s 2000 all over again” and try to haul growth investors off to jail. The bad news, for them, is that life and investing are not nearly as simple as they suppose. The good news is that if one truly understands the way value and growth always have, are, and always will interact, one will be better armed — intellectually speaking — to meet the challenges being posed by Mr. Market.

*** Feature image
© Can Stock Photo / blinow61
What’s Easy: Value Makes Sense, Always Has, Does, And Always Will
Nobody in their right mind would ever buy anything and knowingly pay more than they have to. If Dealer A is offering a car for $28,000 and Dealer B, right next door, is offering the exact same car with all the same options, etc. for $30,000, is there any logical marketplace scenario that could possibly get you to buy from Dealer B?
You might do it if your cousin is the struggling sales person at Dealer B and needs to book that sale to meet a dealership target and avoid getting fired. But that’s not a marketplace scenario.
Or, you might do it if Dealer A is located an hour away, instead of next door. Now it would not really be the same deal. You’d have to factor in the cost to you of going out of your way. You probably won’t make up the gap with $2,000 in transportation costs, but is there a value to having to put in the extra time that can make it better to just pay $30,000 to Dealer B and be done with it.
It’s easy to recognize what a price is — whether it’s $28,000 or $30,00 for a car; a P/E of 18 or 125 for a stock — and whether it’s high or low.
What’s Hard: Execution, Knowing What Something Is Really And Truly Worth
It doesn’t take much imagination to keep expanding and modifying the car-buying hypothetical to justify paying $30,000 to Dealer B. Double check the options. Are they really identical, or did you miss something because the salesperson at A was really slick and talked very fast. Can Dealer B give it to you today, right off the lot, while at Dealer A, you have to wait until the car can be acquired? Etc., etc., etc.
This is a car we’re talking about. This is easy. You can see everything you’re buying, assuming you’re diligent enough to look. Consider how much harder it is to buy shares of stock. The value of what you’re buying (the present value of future cash flows you expect to receive) is invisible (we can’t see the future cash flows, and even with the supposedly more visible input, the rate at which the cash flows should be discounted, all we can do is argue and debate — there is no-carved-in stone absolute answer.
© Can Stock Photo / iqoncept
Now there is one difference between buying a stock and buying a car. For all practical purposes, differences in trading cost and execution, though they haven’t vanished are diminishing to the point where most investors are indifferent between purchasing through brokerage firm A and firm B. The choice is more likely to be to buy the stock at the asking price, or not buy stock. But this doesn’t take you off the hook from the difficulties in figuring out what the stock should be worth to you. Choices to buy (from A or B) or walk away are the foundation of microeconomics, supply-demand analysis. The choice to take it or leave it is no small thing. It’s what markets are all about.
Imagine how much more complex the car buying choice would get if we change the example to have Dealers A and B offering, not the same car, but different brands. Ramp that up a gazillion-fold and you have a sense of what the stock market is all about, where you have a lot more choices than even the most dynamic of car markets.
The Stock Valuation Challenge
A “correct” P/E ratio depends on two things:
- The expected rate for future earnings growth; all else being equal, higher expected growth translates to higher P/E and vice versa.
- The level of business risk inherent in the company; all else being equal, lower expected business risk translates to higher P/E and vice versa.
The basis for this is quite straightforward and derives from financial logic. I described it here, and again in the Appendix below.
What’s not at all straightforward, and actually quite difficult, is plugging in answers, or even guesstimates.

© Can Stock Photo / ixus
Past performance does not assure future outcomes. (Sound familiar?) So you cannot simply pull the historic growth rate and claim to have an input for growth. Nor can you crunch historic share price data, compute Beta, and say (as quants usually do) that you have a measure of company specific-risk. Beta is about the past. Your investment will make or break based on what happens in the future.
But data, which necessarily comes from the past, or at best the present, is all we have given our inability to see into the future.
The key is to use the numbers we have artfully and sensibly in ways that support reasonable assumptions about the future.
- Sometimes, we’ll pick out a number we feel comfortable projecting forward; often changes over time tend to be evolutionary rather than revolutionary. But we can’t soften our discipline here. We need to think datapoint by datapoint why evolution is more probable than revolution. We can’t naively assume it.
- More often, though, we’ll have to make some analytic adjustments to raw numbers and/or pick numbers that allow us to tap into collective investment community judgments about the future. This brings in not just growth rates or even estimates but revision and surprise (signals that previous growth expectations may have to be raised or lowered), momentum, technical patterns and indicators (stocks behavior that could not be logically explainable unless we assume the market is bullish or bearish regarding future prospects), etc.
It’s OK to be a quant, but it’s not OK to work at it in such a way as to imitate mathematicians, engineers, physicists, etc. The easiest way to blow up an investment strategy is to fall into the well-known “physics envy” trap and data mining to the point where you get lost in the “factor zoo.”
It’s better to view and analyze numbers the way a police detective would work with clues that point the investigator toward the identity of one who committed a crime for which there are no eye witnesses. Pardon the analogy but in our case, the crime — aw heck, lets instead call it that which the analyst/investor/investigator is trying to discover — is future company growth and business risk.

© Can Stock Photo / andrianocz
Because it’s in the future, we don’t have any eye witnesses. So unlike police detectives, we’re not likely to be able to accumulate proof beyond a reasonable doubt. That’s OK. In the investment world, with a sensible approach, diversification and proper risk management, we can live quite well with the lowest standard of proof; that which a reasonable person would view as a preponderance of evidence.
This doesn’t mean a sensible value investor will never be wrong. What it does mean is that if and when we are wrong, which is inevitable for any investor, we’ll know what to work on to improve our process.
The sensible value investor will not waste time or energy Twitter flame wars about whether value is dead or we should, as AQR Capital Management founder Cliff Asness likes to say, “cling like grim death” to what we did back in the day. Instead, sensible value investors will devote time and energy to re-evaluating how they assess future growth prospects and business risk and considering whether those processes should be reevaluated. It’s no sin to be wrong. We’re subject to forces we cannot control. We can, however, control the way we assess our errors, so failing to ask the right questions is a sin.
Testing The Framework
This is not an easy thing to test by conventional methods since we’d always be able to argue over whether or not any set of ex ante (before-the-fact) data points did a good-enough job measuring investors’ future expectations. So let’s be a bit creative.
I’m not going to use any investors’ ex ante expectations. Instead, I’m going to use a data item that sheds light on whether investors actually who got it right on day one were ultimately rewarded in the market.
I’m going to look at two groups of stocks; Stocks with Favorable Valuation ratings (lower P/Es), and stocks with Unfavorable Valuation ratings (higher P/Es). To keep it simple, I used the Projected P/E factor (P/E based on the estimate of next year’s EPS) from the 20-factor Chaikin Power Gauge model. Favorably ranked means we publish Bullish or Very Bullish factor ranks on Chaikin Analytics; unfavorable means we show the factor ranks as Bearish or Very Bearish.
I divided each of the Valuation-based groupings according to Growth. Here, I used the Power Gauge Earnings Growth factor, which is proprietary weighted average (to mitigate the impact of oddities that tend to creep into historical numbers) growth rate calculated over the last three to five years. Strong growth companies refer to those with Bullish or very Bullish factor ranks and vice versa for weak-growth companies.
Now, about the historic three- to five-year thing . . . here’s where I change things around from what you see in conventional backtests. I compare the stock’s P/E Factor Score at the starting point to . . . stay with me here . . . the stock’s Earnings Growth Score a year into the future! (Obviously, given my need to look into the future, the test stops well short of mid-2020 — it starts 1/2/12, when Power Gauge went live, and actually stops 8/31/19).
So if my experiment is to show me what I’m hoping to see, then an investor who bought a high P/E stock on 3/31/13 for example would likely say he did a decent job of assessing the company if, on 3/31/14, he would seen, on Chaikin Analytics, a Bullish or Very Bullish score for the Earnings Growth factor.
The one year measurement period for the study is not coterminous with the three to five year growth measurement period. The stock purchase would have been made one year earlier, and is measured against the latter portion of a 3- to 5-year trend that had already been in place. That’s fine. These are the kinds of approximations real-world investors address every nanosecond of every trading day. All we’re looking for is a general sense of whether the market is more likely to reward value investors who do a better job assessing future earnings growth. And, that is, in fact, what the data shows.
Table 1 — Favorable Valuations (Low P/E)
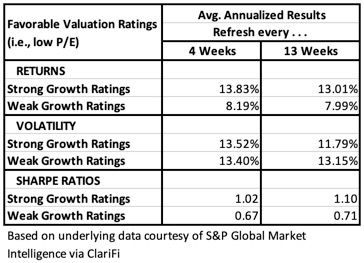
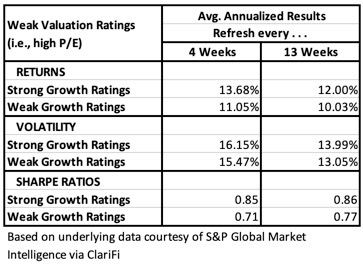
Table 2 – Unfavorable Valuations (High P/E)
The traditional quant approach to value maintains that low P/Es are better. Table 1 suggests, consistent with what logic and financial theory teach us, that this is false. We see that value in the stock market works exactly the way value in other areas of life works. If you pay a low price for good merchandise, things turn out well. If you pay a low price for bad merchandise, things do not turn out so well.
Table 2 confirms the theory by showing that if you pay a high price for good merchandise, there’s no reason to expect that you will be punished, whether from your spouse (who, presumably — hopefully — will love the luxury car you bought) or Mr. Market, who can be expected to give you high fives when you correctly identify great stocks.
The gap between the performance of the high-P/E strong growth and weak growth groups is interesting, though. Directionally, it’s as expected. But the magnitude is much tighter than what we saw with the low-P/E groups. Think back to the nature of this study and the variables being used. High P/E tells us we’re expecting big things. We’re also seeing that we’re not so fast to recognize when the companies are not delivering. One year in, the day-one expectations are starting to crack, but the Street is still clinging to hope. This is in contrast to how quick Table 1 shows the market to be in accepting and leaning into early indications of good news — outperformance of the low-expectations that were initially baked into the low day-one P/Es
Value And Growth Are Therefore Inextricably Intertwined
There’s good news here and bad news.
The good news is that, yes, value investors really are allowed to invest in the most exciting and disruptive growth companies that exist today and in the ETFs that focus on them.
The bad news, whether one calls one’s self a value investor, a growth investor, or whatever, is that this is very, very, very hard. We’re looking into the future and often, with the most exciting companies, we have little or nothing in the past that can be used to anchor our expectations. It’s also hard to recognize when it would be a good idea to modify expectations.
Sometimes, we have events such as the coronavirus pandemic that prompt investors to consider that it might be a good idea to upwardly revise what we think can be achieved by tech, communications and healthcare companies that stand to benefit from the future whose onset may occur more quickly than we originally thought.
And then, at other times, we have events that cause us to reconsider if reaching the future will pose more of a challenge than many initially supposed (as occurred on March 20, 2000, when a Jack Willoughby article in Barron’s pointed out that then-high-flying internet companies were “running out of cash — fast”). Is the recent tech correction such an event?
Where We Are Today
There are those who try to value emerging high-growth stocks using adaptations of traditional discounted cash flow analysis. I’m not among them; I think such approaches make unreasonable demands on the ability of humans to forecast quantitatively.
What we learned about Softbank’s option-buying is nothing like the eye-opening Willoughby 2020 article. It supports the view that some of the recent upward price action was unusual and unsustainable. But it gives us no reason to question the viability of the companies investors have lately been favoring. In one sense, that’s soothing. On the other hand, it leaves us with greater challenges. We still have to address the question of how high should stocks go today in order to properly reflect on uncertain higher levels of corporate wealth that is expected at an uncertain future point in time. The Willoughby question was easy. Today’s questions are not.
There is a strong desire and temptation in today’s quant driven world to come up with numbers. If you do that by sticking with companies that are more entrenched in the world of today and amenable to standard projection methods. That’s OK. Warren Buffett made a career and a brand doing that (if you read his letters, you see he has focused on visibility/predictability of business prospects, not P/E).
If you want to aim for substantial growth, however, then you will have to accept the risk of diminished predictability and understand that your stocks are apt to be bounced up and down from time to time as the investment community wrestles with expectations. The classic approach to such investing is to do in-depth company-specific analysis. If you have the time and skill to do that, go for it. Most investors, including me, don’t have the background that would support this sort of thing.
At Chaikin, we address such challenges by combining (i) our 20-factor technical-fundamental Power Gauge model that has a bona fide focus on value factors and also a lot that measure future growth potential, in some instances by looking at historic data in ways we believe support forward-looking inferences and in other instances through various sentiment and market oriented factors that tap into the always-evolving subjective judgments of key investment community constituencies and (ii) screen/filter-like “setups” through which we place greater emphasis on stocks that suggest buying or selling based on assessment of various chart indicators. Through this framework, we combine fundamental data with a wisdom-of-crowd approach. The latter can be expanded through ETFs that specialize in investing companies like this, such as those offered by ARK Invest, which supports its actively managed ETFs by intense company-specific analysis by analysts who have the skills to do it (and we rate such ETFs through a model based on Power Gauge analysis of holdings as well as technical analysis of the ETF itself).
We won’t claim that we can catch all the peaks and troughs nor would we take seriously anybody who would make such a reckless claim. However, as discussed in this prior post, we do believe investors would have successfully avoided calamity in the early 2000s had our model been invented back then and can navigate them today. (The factors we look at showed themselves capable of flagging the bad-company problems about which Willoughby wrote and which sparked that bear market).
Whatever you do, as long as your process is sensible and rational make choices between high growth, modest growth, or even cigar-butt turnaround plays (you can lose your shirt with a P/E of 5 if the company goes broke) based on assessment of future growth prospects — directly and/or via proxy crowd-based approaches — and consistent with your risk tolerance, never feel pressured to apologize for high P/Es of your holdings or tempted to brag about their low P/Es.
APPENDIX
Here’s the roadmap to assessing P/E. (Analogous frameworks can be applied to other valuation ratios involving Enterprise Value, Sales, Cash Flow, Book Value, etc. The key is that there be a relationship between the price of a stock and a per-share measure of corporate wealth.)
- A stock is worth the present value of expected future cash flows (dividends and proceeds from an eventual sale).
- A convenient way to express the above (in light of uncertainty about when a sales will be made) is the Gordon Dividend Discount Model: P = D / (R-G) where P is price, D is the next dividend, R is the Required rate of return (the “discount rate”), and G is the expected future rate of dividend growth.
- Decide R based on debating skills, or to make it easy, just use the Capital Asset Pricing Model which computes R as the risk-free rate plus a bonus you compute by the extra rate-premium you demand for bypassing risk-free securities in favor of stocks in general times a measure of how much riskier the stock in question is compared to the typical stock.
- Given today’s market culture that looks at earnings rather than dividends, we can get away with swapping E, Earnings, for D, so now we have: P = E / (R-G)
- Those of us who remember middle-school algebra know we can rearrange the equation to compute an ideal P/E which is: P/E = 1 / (R-G)
- Those of us who remember even more algebra can recognize that as G (a negative number in the denominator) rises, so, too does P/E, and that as R (a positive number in the denominator) falls, P/E rises.
So does this mesh with the real world? It sure does! We all know about the PE-to-Growth (PEG) ratio, which tells us that higher Growth justifies higher P/E. We also know that lower R justifies higher P/E (the biggest part of R involves interest rates and we all know how stocks as a whole, P/Es across the board, benefit from lower rates). We also know from life that lower risk is valuable and comes at a cost. (You buy car insurance don’t you.) So, too, with stocks.
So there it is. Looking at ratios like P/E, in isolation, is just plain wrong. Investors need to compare P/E to 1 / (R-G).
Marc Gerstein, Director of Research at Chaikin Analytics, is an oddball sort of quant. He has long specialized in rules/factor-based equity investing strategies and has been addicted to stock screening since the days when the program was loaded into a pc on a 5 1/4” floppy disc that went into Drive A and the disc holding data went into Drive B. But he hates fancy math has no use for by-now stale “factor” worship. He favors theoretically sound quant approaches, such as the Chaikin Power Gauge model, that generate active, actionable ideas for the real world. In his spare time, he tries to dull the pain of following the NY Jets and Knicks with reality TV and literature. (We have quantamental, so why not literatrash?)
Twitter: @MHGerstein
Friend me on Goodreads
#Value #Growth #Correction #P/E #DisruptiveGrowth #Quant # Chaikin #PowerGauge