A risk profile can be a tricky thing. I say that because depending on how optimistic I am about the market on the day I fill out my risk survey, I can end up losing more of my hard earned money than I realized was possible, or leaving more money on the table than expected. In either scenario, I, like many other investors, start to second guess the strategy agreed on with my advisor during times of steep market losses, or if my market gains don’t reasonably outpace the benchmark. I might even attempt to “update” my risk profile after such realizations despite the advice on not being emotional about investing.
Money however is money, and while I may not be able to articulate my “average risk tolerance,” I can probably tell you exactly how much money I’m willing to lose. While a risk model addresses risk by limiting the types of investments I am allowed to enter, what about a strategy that cares more about when I exit a position? Turns out I’m not the only one who thinks in terms of dollars lost (because dollars gained has no ceiling, while dollars lost has a floor). I recently came across a quant-based investment strategy that addresses this exact conundrum by utilizing a disciplined approach to applying stop-losses. However, while it seems to address the emotional side of investing where it would be crystal clear how much loss exposure I have, I was curious how, when applied, it might impact my overall gains.
I then decided to run a simple analysis to test both methods of investing—risk profile vs stop-losses, and compare the outcomes. To do this, I found a typical moderate and aggressive ETF portfolio, in this case recommended by Kiplinger since I was looking for something not specific to any one fund-family, and because I don’t have access to advisor-based tools and was limited to what Google returned as results (while they also had a conservative model, I chose not to use it since I still have some youth on my side and wouldn’t be needing the bulk of the funds for at least 30 years). With the investment vehicle selected, the stop-loss strategy comes next. I developed a stop-loss strategy that could be repeated programmatically and used for comparison, which I then analyzed with a simple excel backtest.
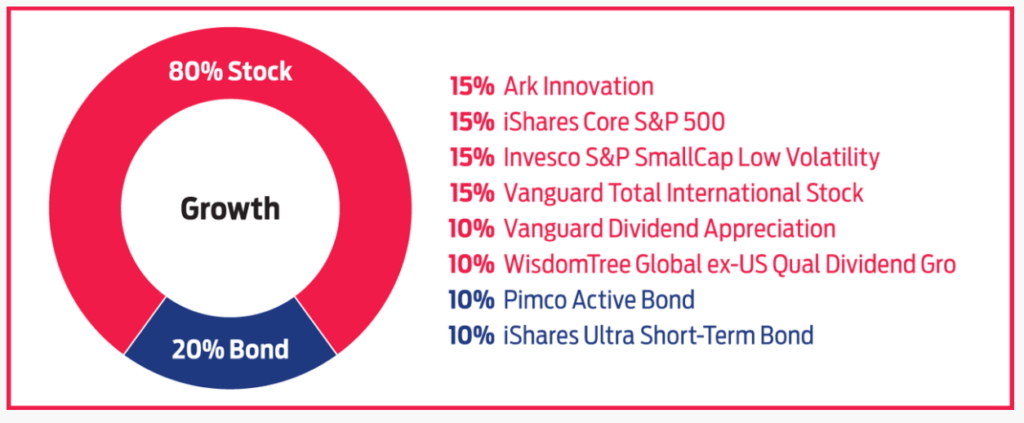
Kiplinger Aggressive (Maximum Growth) Model:
(source: Best ETFs for Your Investment Portfolios)
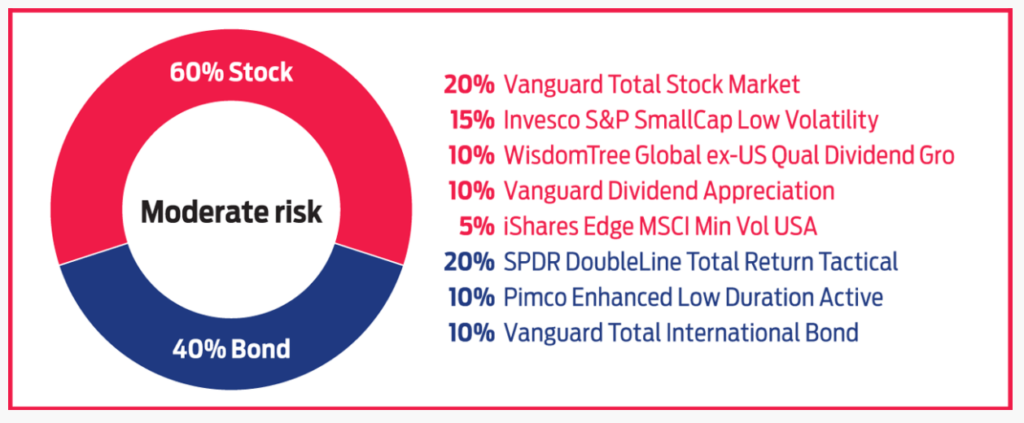
Kiplinger Moderate Risk Model:(source: Best ETFs for Your Investment Portfolios)
Stop-loss strategy:
Given that portfolios are expected to go up over time, I opted to use a trailing stop-loss strategy. That is, I programmed each position to stop out at a -10% decline from the max if that also coincided with being below the long term moving average (200-day DEMA). For simplicity, once the stop triggered a sale, I would sell 100% of the position and maintain cash as opposed to reinvesting in a different position. For reentry, I would repurchase the same position in the amount of available cash according to the following scenarios:
- If the position dropped at least 5% more, I repurchased on the first oversold indicator that came back up to 30% (after all, the point is to try to sell high and buy low)
- If the position did not drop at least 5% more, I repurchased it once again when it reached its long term average in a positive uptrend
All purchase scenarios were based on the daily adjusted closing price.
Risk-based model outcomes over the last 5 years:
To make the scenario easier to follow, I assumed I invested ~$100,000 in each portfolio 5 years ago according to the recommended allocation above. Below is a simple price chart on how the portfolio aggregated.
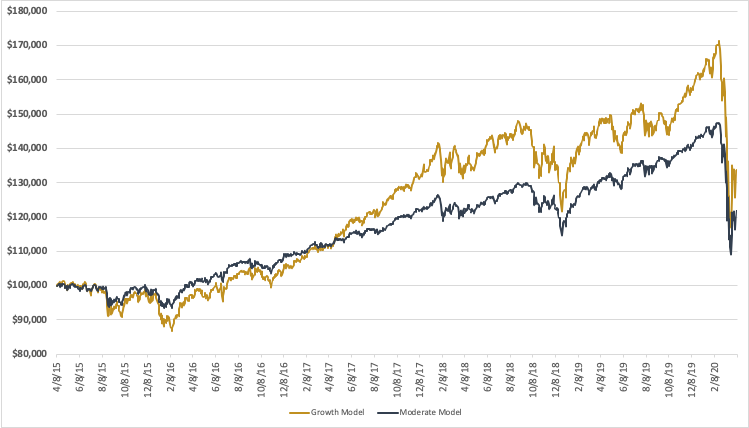
Below are the stats for each model’s returns:
| Growth Model | Moderate Model | |
| Current gain/loss | $133,866 (33.87%) | $121,919 (21.92%) |
| Max gain (high over 5 years) | $171,386 (71.39%) | $147,520 (47.52%) |
| Max loss (low over 5 years) | -$86,727 (-13.28%) | -$93,419 (-6.59%) |
While both models have me positive 5 years later, I would still be very aware of the current ~$37,500 (38%) or ~$25,600 (26%) loss from the max (difference between max and current) on the growth and moderate models respectively.
Stop-loss strategy outcomes over the last 5 years:
If I instead applied the more complex stop-loss strategy versus the aggressive model (since that performed better), my returns would have instead compare something like this:
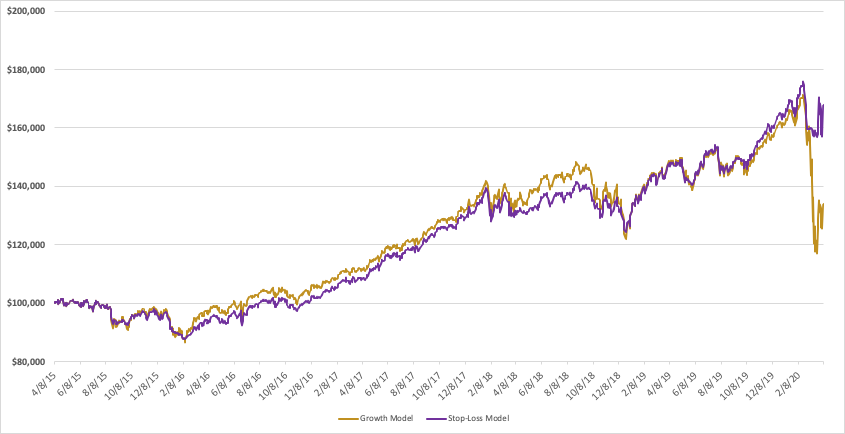
And now comparing the growth model vs stop-loss strategy:
| Growth Model | Stop-loss Strategy | |
| Current gain/loss | $133,866 (33.87%) | $167,839 (67.84%) |
| Max gain (high over 5 years) | $171,386 (71.39%) | $175,544 (75.54%) |
| Max loss (low over 5 years) | -$86,727 (-13.28%) | -$87,699 (-12.31%) |
The stop-loss strategy achieved ~4% higher than the Aggressive Growth model’s max, and with only an 8% current loss from the max as opposed to a 38% loss from the max in the Aggressive Growth model. Also of interest, I’ll note that all positions ended higher in the stop-loss strategy except for one for which the stop exit was never triggered.
While the timeframe used here is very short, it seems that the stop-loss model performs better during market corrections and sets the investor up for re-growth as the market makes a turn. It doesn’t work 100% of the time, and as the chart shows, it didn’t start to outperform the Aggressive Growth model until the market correction at the end of 2018. However, for maintaining a very clear assessment of risk for only slightly less performance, that might be a win-win!
I’ll also note that I came across a few ETFs that employ similar strategies and would therefore be much less involved than actively managing the stop-loss approach above. These include the Pacer TrendPilot® ETFs, for which an example vs the S&P 500 (SPY) as a benchmark is shown below.
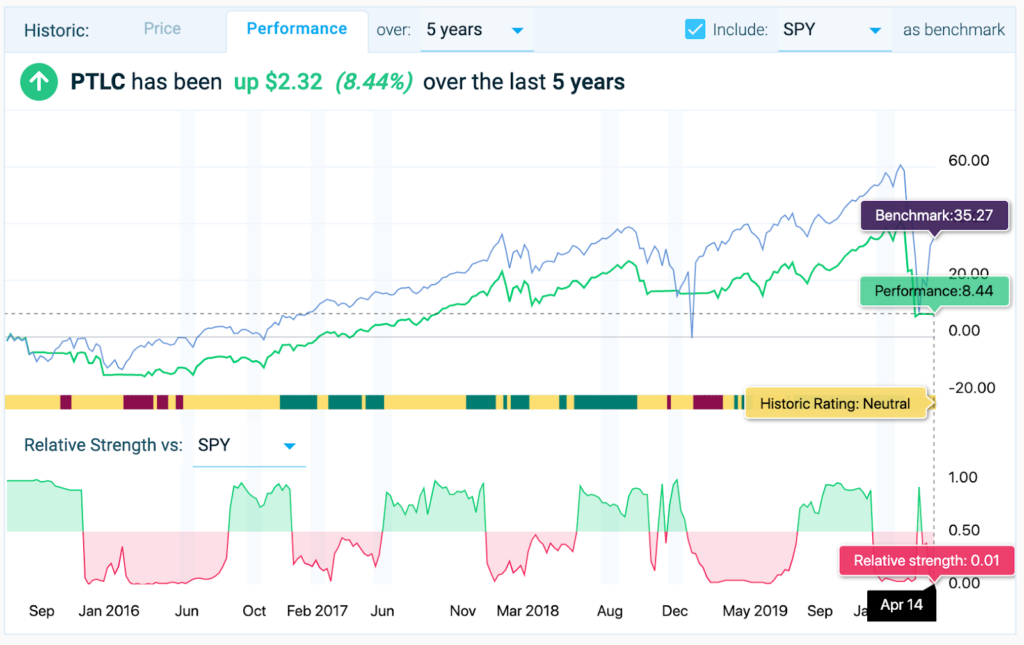
These ETFs would still need to be assessed as appropriate or inappropriate for investment according to characteristics such as for expense ratios, betas, forward potentials etc. This is especially important, seeing that PTLC, despite this strategy, is underperforming the market benchmark. I might still want to consider how I would feel if I didn’t outperform and am leaving money on the table since there’s no “stop-loss” for gains.
Summary:
My risk tolerance seems to take the same shape as the market—the higher the bull market climbs, the more risky I am, and the more my expectations rise, while when the tides turn, the more conservative I am and wanting to protect my losses. I think rather than defining my risk tolerance from a survey I would like to hear an advisor ask me how much of my investment I would be comfortable losing before taking more of a cash position. And even if I don’t outperform an aggressive model using this type of strategy, at least all outcomes would be in line with my expectations—regardless of the direction of the market.